This site works best with JavaScript enabled. Please enable JavaScript to get the best experience from this site.
What steps will reproduce the problem?10 min CPU profiling during random dungeon run using Addon Profiler.
What is the expected output? What do you see instead?Lower CPU usage. CPU usage extremely high in comparison to other Unit Frames add-ons (Shadowed UF, Grid,etc) and other add-ons in general.
What version of the product are you using?v4.0.0-beta17
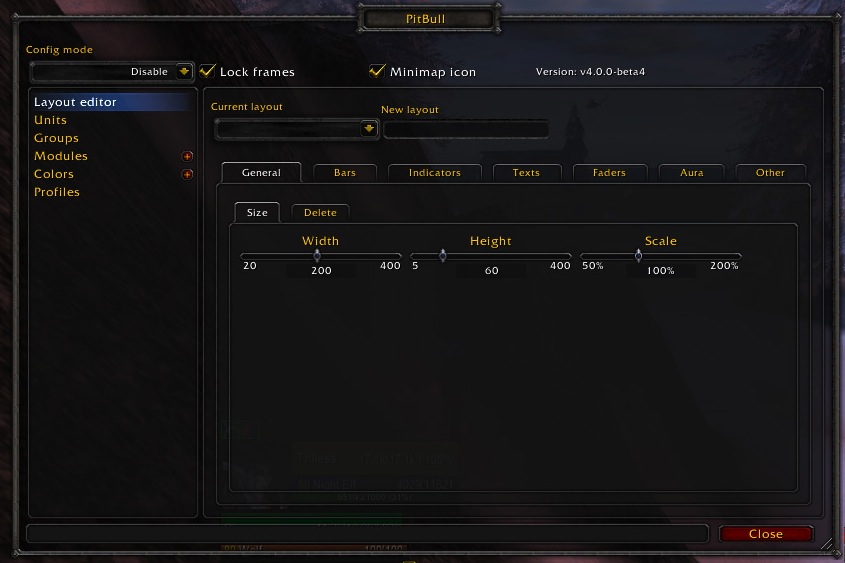
Do you have an error log of what happened?Screen shot attached. Data was recorded during H HoS run.
Please provide any additional information below.
Screenshot and your results are worthless. It's obvious from the screenshot you're not running disembeded. PitBull4 might be the one providing the libraries that other addons are using and thus getting charged for their usage.
In short, you can't just load up AddOn Profiler and make conclusions like this without really knowing what you are doing.
Closing as invalid.
Please let me know what the valid report would be for this? I've tested this without any other addons running (excepto for AP) , disembeded, etc with similar results. This is my healer profile with the following frames enabled only: player, target, target's target, target of target's target. No party frames. I've also disable several unused modules such as voice icon, cast bar latency, etc.
Thanks.
Enabling targettarget and targettargettarget is always going to burn a fair amount of CPU. We have no way of updating that except to poll.
Yes we use more CPU time than other addons a lot of that is a limitation of the fact that we have dynamic layouts instead of static layouts. An example of this is say you put two things in the top right corner. In say Shadowed those two things would either be on top of each other or you'd have to configure them to appear in different spots. You could not for example configure them to shift based on the presence of another item.
We also often have our own timers as opposed to using AceTimer for everything. Which means against other addons that always use a timer library, if you disembed the timer library is going to show as using the CPU time for that addons timers. Interestingly enough timers are probably the place where unit frames chew up the most time because we have to poll to update some things.
So for the most part what you're seeing with your profiler is either a result of features we have that do take up more CPU time and that we're not inclined to remove or it's a result of simply profiling not giving you an accurate picture.
Finally, you can't compare your unit frame mod to other addons. It's almost always going to have some of the most CPU intensive code that you're running. It has a lot of things to update and display.
If you want to do some serious work at profiling the addon and finding problems then we can talk. But you'd need to have a good understanding of how everything works.
Are there places where performance could be improved, probably. I fix them as I come across them. I've profiled the addon pretty extensively looking for places we can improve.
To post a comment, please login or register a new account.