Skada Graphs
Adds graph display systems to Skada. Uses Cryect's excellent LibGraph-2.0. To use these, create a new window in Skada. While doing so, choose one of the new display systems instead of the built-in bar display. Both use the normal Skada way of navigating, but also have buttons for it. Scrolling is also done the Skada way (mousewheel).
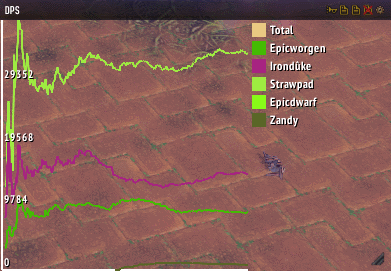
Currently there are two new display systems:
Historic line display is roughly equivalent to the realtime graphs in Recount. No permanent additional data is stored, only transiently while displaying. You can find an option allowing you to switch between "RealTime" and "Total data" modes in the options panel.
Pie display is a simple pie chart.
Feel free to report any issue you might encounter. If you can't find what you're looking for in the graphs, please let me know.
Comments


-

zarnivoop Owner
-

Forge_User_11601074 Maintainer
-
View User Profile
-
Send Message
Posted Oct 31, 2017Hello,
will the plugin be further developed?
In WoW it is displayed as obsolete.
-
View User Profile
-
Send Message
Posted Dec 11, 2016Thanks for the graph, great for 5 mans... but very cluttered for raiding.
If possible, in the legend area, allow for us to select which individuals to be displayed in the graph (everyone displayed by default)
-
View User Profile
-
Send Message
Posted Sep 12, 2016Would be great to have a setting to remove the legend portion to maximize the width of the graph within the window.
-
View User Profile
-
Send Message
Posted May 15, 2016Nice plugin.
I would like to be able to remove the titletext etc to make the window invisible just like the normal skada window.
-
View User Profile
-
Send Message
Posted May 16, 2016Hi,
I think you should be able to do so now.
Just tick/untick the box "Enable Header" on the options panel.
-
View User Profile
-
Send Message
Posted May 18, 2016you are the best!
-
View User Profile
-
Send Message
Posted Feb 20, 2016It isn't working as it pretends. Need to be updated.
Causing too much lag when running, the graphic dont show total damage...
Wast of time. :(
-
View User Profile
-
Send Message
Posted Feb 21, 2016Heya !
As this addon collect a ton of data from skada, it's true it could really drops your FPS on some systems. I've improved it a little a while ago, but can't do much more for now, because of the way it's getting its data input.
As for total damage problem, you reminded me I should have added an option to switch between 'Total' and 'RealTime' modes a while ago...
I corrected it, and you should now be able to select that mode from the option panel if you need it.
-
View User Profile
-
Send Message
Posted Aug 8, 2015last comments is really old. just wanted to say that it works fine under WoD 6.2. nice addon. would love to see more options cause i like options :)
-
View User Profile
-
Send Message
Posted Sep 18, 2013clearly not
au revoir
-
View User Profile
-
Send Message
Posted Aug 16, 2013is this still a thing? hasn't been updated for almost 2 years. just locks up 64x wow.
-
View User Profile
-
Send Message
Posted Jul 20, 20137/20 17:48:51.349 ** Loading table of contents Interface\AddOns\SkadaGraph\SkadaGraph.toc
7/20 17:48:51.349 ++ Loading file Interface\AddOns\SkadaGraph\embeds.xml
7/20 17:48:51.349 Error loading Interface\AddOns\SkadaGraph\lib\LibDataBroker-1.1\LibDataBroker-1.1.lua
7/20 17:48:51.349 Couldn't open Interface\AddOns\SkadaGraph\lib\AceGUI-3.0-SharedMediaWidgets\widget.xml
-
View User Profile
-
Send Message
Posted Nov 10, 2012Doesn't seem to work in 64 bit version of wow, but just locks up whole game when enabled window with historic line graph.
-
View User Profile
-
Send Message
Posted Jan 25, 2013" Doesn't seem to work in 64 bit version of wow, but just locks up whole game when enabled window with historic line graph."
-
View User Profile
-
Send Message
Posted Aug 30, 2012Has this been incorporated into skada? Or is there any chance anyone knows if this addon to skada is a memry heavy as the recount counterpart?
-
View User Profile
-
Send Message
Posted Jul 1, 2012I'm willing to run in 32bit mode just to be able to see the graph version. Recount's overall Raid DPS is nice, but I'd rather see realtime DPS on a graph for everyone in the raid.
I can't figure out how to enable. Could anyone point out how to enable and see the historic line graph?
-
View User Profile
-
Send Message
Posted Jul 6, 2012Create a new window in the Skada configuration window, and while doing so, choose the historic line graph type.
It is not the most intuitive way, true. This addon was just a proof of concept I made last year, really. I may fix the 64bit issue and integrate it better at some point.
-
View User Profile
-
Send Message
Posted Feb 3, 2012I've encountered a problem when using the new 64 bit client. The client freezes in the loading screen (with full progress bar) when trying to log in with the graph display on, and I'm forced to terminate the process using the task manager.
Tested it by disabling all other addons except Skada itself and the Graph display, and thus pinned it down to this particular addon. Without the addon the 64 bit client works like a charm. Tested this with the normal x86 client and all seem to work normally there.
I can't be 100% sure tho that the addon is the root of all evil here, just wanted to bring this to your attention in case there are other reports of the same nature.
-
View User Profile
-
Send Message
Posted Feb 14, 2012I got the same issue in the 64bit. Everything was working fine until I created a new window using the historic line graph, then the entire game froze and had to be closed manually. I tested with the 32bit client and it runs normally.
-
View User Profile
-
Send Message
Posted Dec 1, 2011heres a bug i got on login, picked up by swatter, looks like libGraph is missing or it just cant find it, im not a programmer though , just my best guess.
Date: 2011-11-29 21:47:53
ID: 2
Error occured in: Global
Count: 1
Message: ..\AddOns\SkadaGraph\PieChart.lua line 14:
Cannot find a library instance of "LibGraph-2.0".
Debug:
[C]: ?
[C]: error()
!Swatter\Support\LibStub.lua:23: LibStub()
SkadaGraph\PieChart.lua:14: in main chunk
AddOns:
Swatter, v5.12.5198 (QuirkyKiwi)
ArkInventory, v3.02
ArkInventoryRules, v
AucAdvanced, v5.12.5198 (QuirkyKiwi)
AucFilterBasic, v5.12.5198 (QuirkyKiwi)
AucFilterOutlier, v5.12.5198.5194(5.12/embedded)
AucMatchUndercut, v5.12.5198.4828(5.12/embedded)
AucStatHistogram, v5.12.5198 (QuirkyKiwi)
AucStatiLevel, v5.12.5198 (QuirkyKiwi)
AucStatPurchased, v5.12.5198 (QuirkyKiwi)
AucStatSales, v5.12.5198.4838(5.12/embedded)
AucStatSimple, v5.12.5198 (QuirkyKiwi)
AucStatStdDev, v5.12.5198 (QuirkyKiwi)
AucStatWOWEcon, v5.12.5198.4828(5.12/embedded)
AucUtilAHWindowControl, v5.12.5198.5133(5.12/embedded)
AucUtilAppraiser, v5.12.5198.5194(5.12/embedded)
AucUtilAskPrice, v5.12.5198.5162(5.12/embedded)
AucUtilAutoMagic, v5.12.5198.5184(5.12/embedded)
AucUtilCompactUI, v5.12.5198.5016(5.12/embedded)
AucUtilEasyBuyout, v5.12.5198.4897(5.12/embedded)
AucUtilFixAH, v5.12.5198 (QuirkyKiwi)
AucUtilItemSuggest, v5.12.5198.5144(5.12/embedded)
AucUtilPriceLevel, v5.12.5198.4861(5.12/embedded)
AucUtilScanButton, v5.12.5198.5159(5.12/embedded)
AucUtilScanFinish, v5.12.5198.5159(5.12/embedded)
Auctionator, v2.9.9
AutoRepair, v
Babylonian, v5.1.DEV.312(/embedded)
BeanCounter, v5.12.5198 (QuirkyKiwi)
BloodyScreen, v
Carbonite, v4.22
CarboniteTransfer, v1.01
ChocolateBar, vv2.2.3
Configator, v5.1.DEV.312(/embedded)
DBMCore, v
DBMInterrupts, v3.3.2
DBMLDB, v
DBMSpellTimers, v
DBMVictorySound, v1.8.1
DebugLib, v5.1.DEV.312(/embedded)
GearScore, v4.10.01.00
HeadShot, v2.0.40200
Killshot, vv5.14 (28-09-2011)
KillshotSounds, vv1.00
LibExtraTip, v5.12.DEV.311(/embedded)
MikScrollingBattleText, v5.6.111
Postal, v3.4.10
Prat30, v3.4.25
Prat30HighCPUUsageModules, v
Prat30Libraries, v
Quartz, v3.0.7
RazerNaga, v2.1.0
RazerNagaXP, v
Skada, v1.3-8
SkadaAbsorbs, v1.0
SkadaCC, v1.0
SkadaDamage, v1.0
SkadaDamageTaken, v1.0
SkadaDeaths, v1.0
SkadaDebuffs, v1.0
SkadaDispels, v1.0
SkadaEnemies, v1.0
SkadaGraph, v1.0
Stubby, v5.12.5198 (QuirkyKiwi)
TipHelper, v5.12.DEV.310(/embedded)
BlizRuntimeLib_enUS v4.3.0.40300 <us>
(ck=85f)